According to the Oxford English Dictionary, an infographic is “a visual image such as a chart or diagram used to represent information or data in an easily understandable form.”
As you might have guessed from this definition, infographics are versatile tools that can be used across a wide range of mediums to engage people and effectively share information.
Infographics are 30 times more likely to be read than a written article, and they can increase website traffic by up to 12%.
An infographic is more than a large graphic. It’s a collection of imagery and graphics that use data (like pie charts and bar graphs) and minimal text to tell a story, explain a process, or provide an easy-to-understand overview of a topic. First, the engaging visuals attract our attention. But to be effective, they must then help us understand and remember the information.
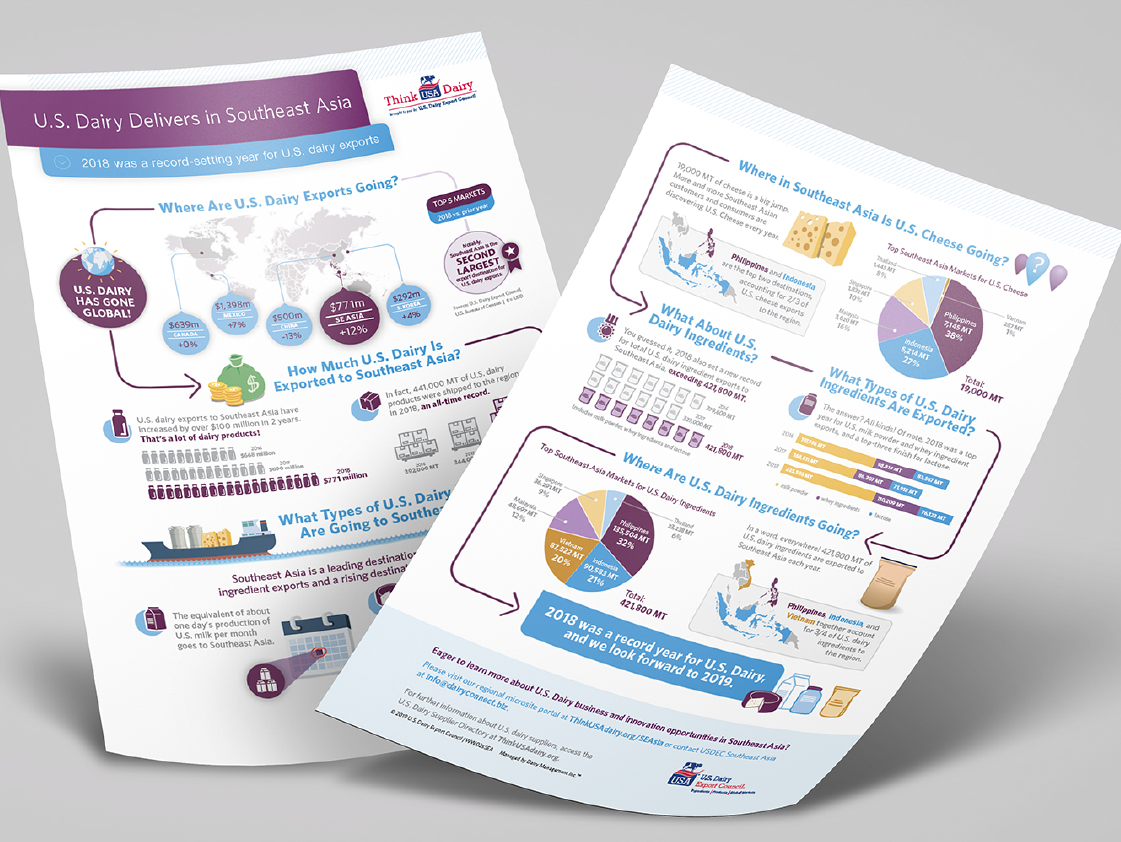
Here’s an example of an infographic:

In this infographic, we used data points provided by the U.S. Dairy Export Council (USDEC) to craft a visual story that conveys U.S. dairy’s impact in Southeast Asia. First, we developed a framework of questions to engage the reader and organized the data into those sections. Then, we designed a system of graphics that represent each point with numbers, products, and countries, leading readers through the story of growth. By presenting these growth stats as a story, it helps readers understand and retain the information.
This infographic can do in one minute what could otherwise take a lengthy conversation.
USDEC’s Vice President, Global Ingredients Marketing, Kristi Saitama, said, “Novak Birch took a rough concept intended to document statistics at a glance and turned it into a powerful, multi-purpose, multi-audience communications tool that can do in one minute what could otherwise take a lengthy conversation.”
Infographics Can Increase Your Reach, ROI, and Brand Awareness
Infographics are versatile—once you have one, it can be used in a myriad of ways, increasing your reach, ROI, and brand awareness. For example:
- USDEC used the infographic above online and offline, including for media engagement.
- We divided the infographic up into mini graphics sharing each fact or statistic, and USDEC shared these on social media and used them in PowerPoint presentations.
- The infographic has been used across USDEC programs in Southeast Asia to generate excitement about U.S. dairy export products, and its use has expanded exponentially. Kristi Saitama said, “The original intended audience was importers/distributors and food and beverage manufacturers in Southeast Asia. However, the infographic is so impactful that we also used it as a resource for U.S. dairy suppliers in the USA, to convey the rising potential for U.S. dairy exports to Southeast Asia.
- It has also been featured on websites, including Dairy Business, Milk Business, Agri-View, F&B Report, industrysourcing.com, and USDEC’s blog.
People retain 65% of information if the content is paired with a relevant image, and posts with images have a 650% higher engagement rate than posts without images.
Infographics are especially helpful when used on the web or digitally. According to DemandSage, infographics can increase website traffic by up to 12%. When you’re creating an infographic for web/digital use, it’s important to optimize it for SEO as you design it. This will improve your search results and drive more traffic to your website. Infographics can also help you earn organic backlinks, improving your website’s ranking in image search and spreading awareness of your brand. Plus, infographics are easy to share, which can boost your engagement rate.
How Should I Use Infographics?
So, how can you put infographics to work for you? Think about the type of information you share with your customers or target audience. What’s your goal? An infographic is a great way to:
- Summarize data and make it easier to understand.
- Provide an at-a-glance overview of a topic, product, or service.
- Explain a process.
- Demonstrate the difference between two or more things.
- Raise awareness of a cause or issue.
If you’re looking to accomplish any of these things, an infographic can help you do it.
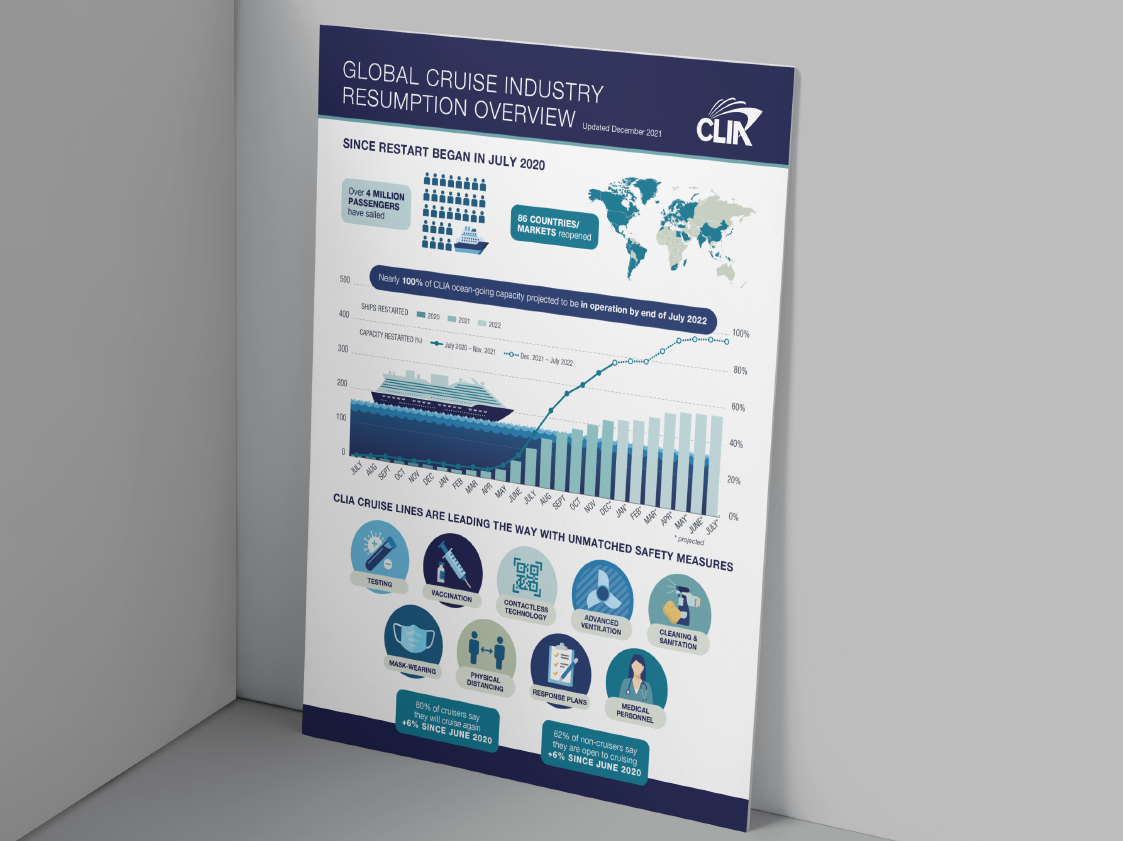
For instance, here’s an infographic that shares important updates and data from Cruise Lines International Association (CLIA). As the effects of the pandemic began to recede, CLIA started planning for phased cruise resumption. They needed to share frequent, updated information with the cruise industry to keep them apprised of updates, including health and safety measures being designed to help protect passengers, crews, and destinations.
We designed and wrote infographics sharing up-to-date information that CLIA used across a variety of mediums to keep the cruise industry informed. This visual representation of information cuts through the noise, standing out more than a report sharing the same information.

Whether you need to provide a high-level overview of a topic or explain a complex process, infographics are a great tool to use. They draw in your audience with visuals, break down information into bite-sized chunks for easy understanding, and visually lead readers through the story or process. Plus, they can be used in dozens of ways, both online and offline, and can capture valuable information about your target audience to help guide your business outreach strategy.